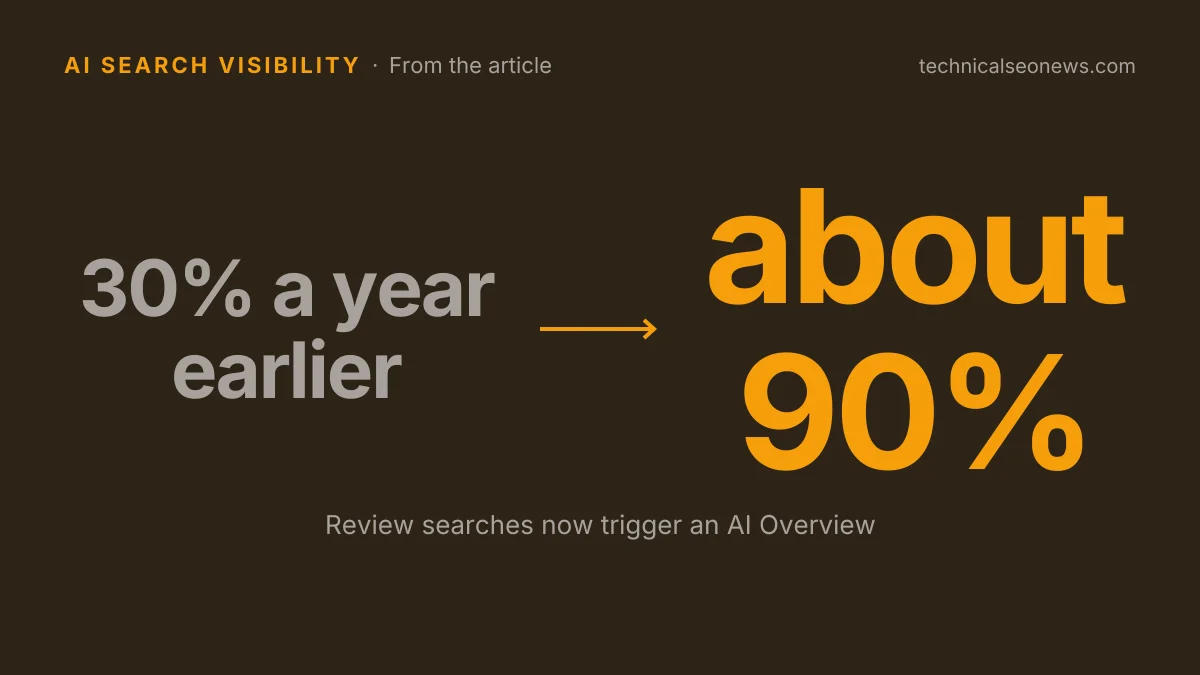
Review searches now trigger an AI Overview 90% of the time
Summary
Semrush's year-long panel of commercial keywords shows an AI Overview on nearly every US desktop result page, with review searches the fastest riser at about 90%.
Pull AI Overview coverage for your own commercial keywords and track whether the summary names your product accurately, because the panel rate will not match your set.
Review searches now trigger an AI Overview on about 90% of US desktop result pages, up from 30% a year earlier, according to Semrush’s study of commercial search modifiers. Semrush tracked a fixed panel of 400 keywords every month from September 2025 through August 2026.
The panel covers five modifiers people type when they are close to a decision: alternatives, brand vs. brand, best X for Y, pricing and cost, and reviews. Every group finished above 80%.
| Modifier | Aug 2026 | Change since Sept 2025 |
|---|---|---|
| Best X for Y | 96% | +53 points |
| Reviews | 90% | +59 points |
| Brand vs. brand | 86% | +23 points |
| Alternatives | 82% | +34 points |
Semrush does not break out a figure for pricing and cost, but says every modifier group finished between 82% and 96%. A year ago the modifier told a keyword plan something useful: reviews drew an AI Overview 30% of the time while brand comparisons drew one 63% of the time, so there was a quieter end to lean toward. The spread across the five groups is now 14 points, which means choosing one commercial modifier over another no longer avoids much.
Industry makes little difference either. Ecommerce keywords had the largest jump of the three verticals, from 32.62% coverage to 85.11%. By August all three sat between 85% and 91%. A year earlier the gap between the highest and lowest vertical was more than 35 points. Now it is under six.
Three of the 15 industry-and-modifier combinations are still below 80%.
| Combination | Aug 2026 |
|---|---|
| Alternatives in banking | 65% |
| Pricing and cost in ecommerce | 71.43% |
| Reviews in software | 75% |
Those look like openings, but the likelier outcome is that they close. Ecommerce pricing queries started the year at 4.76%, so even the lowest of the three gained nearly 67 points in twelve months. All 15 combinations finished higher than they started, and three reached 100%.
For a traffic forecast, the headline coverage figure understates what searchers meet. Weighted by estimated monthly search volume, August coverage hit 97.08%, against 88% when every keyword in the panel counts once. The highest-demand commercial queries were the likeliest to carry an AI Overview.
One caveat limits how far this transfers: the panel is US desktop only, and Semrush does not report mobile. Desktop is also where AI Overview detection has already broken once, when the label disappeared on desktop while mobile kept it, so a tool’s coverage number for a given month is only as good as its ability to spot the feature that month.
What to do
On these queries the AI Overview makes the first impression, and Semrush’s argument is that for some searchers the summary is enough to decide.
- Measure your own tracked set rather than importing 88%. The panel is 400 keywords in banking, ecommerce, and software, and your coverage depends on your keywords.
- Weight by search volume when the output is a traffic forecast, and by keyword count when the question is how far the feature has spread.
- Track the answer, not only the position. Semrush’s recommendation is to check which sources get cited for your key commercial searches and whether the AI Overview describes your product accurately.
- Fix the third-party pages that describe you, not just your own. Broad product queries tend to cite listicles rather than the brands in them, which puts someone else’s comparison table in front of the buyer.
- Recheck the low-coverage segments quarterly instead of building a year of planning on them.