Desktop merchant impressions ran 3 to 7x high in one SEO's data
Summary
Desktop impressions for Search Console's merchant listings appearance ran 3 to 7x above baseline for five months in one practitioner's shops while clicks stayed flat, so impressions, CTR and average position are unreliable for that window.
Use clicks for any comparison that spans May to October.
A practitioner posting as u/DrKJING, who published anonymized Search Console data from several online shops, reported in r/TechSEO that desktop impressions for the merchant listings search appearance ramped up over about five days from May 16 and stopped dead on Oct 9. The shops are unrelated to each other, in different sectors and sizes, and the steps landed on the same days in all of them.
The baseline in the post is April 15 to May 14, indexed at 100. Shop A’s desktop index climbed from 105 to 713 inside a week. From late May to early October the three properties averaged between 3.1x and 6.5x baseline. Mobile impressions rose nowhere. In two shops they fell to roughly half or two thirds of baseline and stayed there.
Desktop clicks did not move with the impressions, running at 57% to 83% of baseline through the window, so desktop CTR fell to almost nothing. Since Oct 9 it sits roughly where mobile CTR sat in April:
| Property | Desktop CTR, May 16 to Oct 8 | Desktop CTR since Oct 9 | Mobile CTR, April |
|---|---|---|---|
| A | 0.3% | 16.8% | 14% |
| B | 0.2% | 5.4% | 4% |
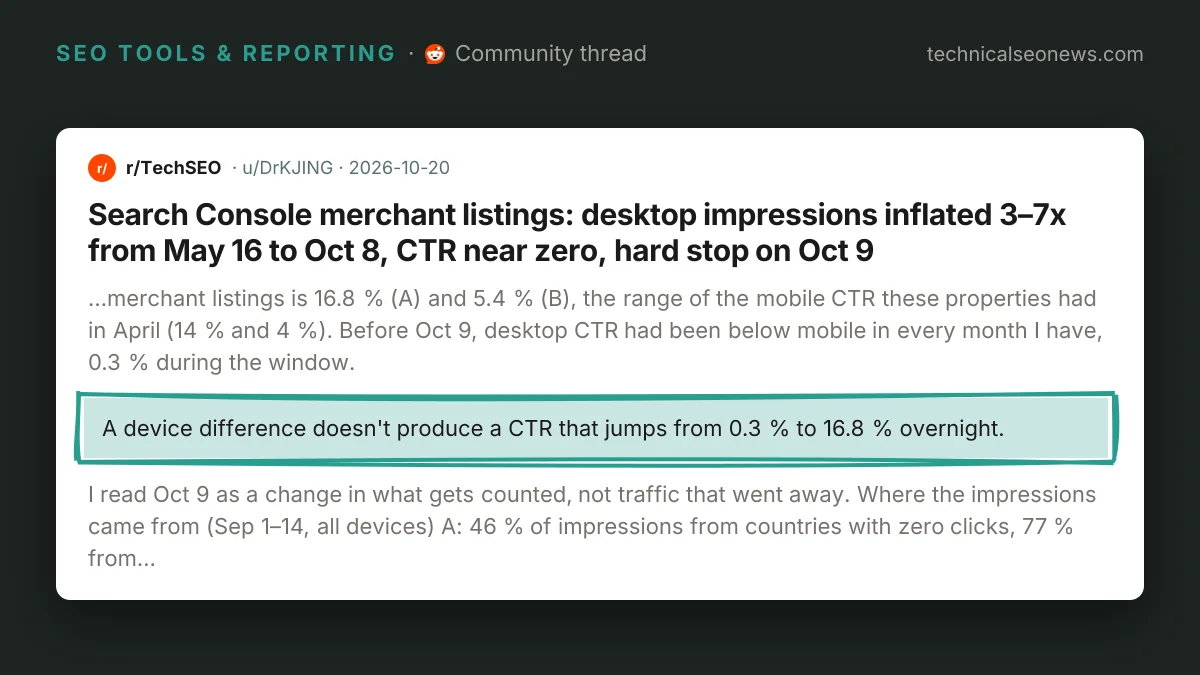
DrKJING reads Oct 9 as a change in what gets counted rather than traffic that went away, and a CTR that moves from 0.3% to 16.8% overnight is hard to explain any other way. Users do not behave differently on desktop one day and like mobile users the next.
Much of the extra impressions came from places that never clicked. In the first two weeks of September, 46% of shop A’s impressions came from countries with zero clicks, with Brazil the largest single share at 12%. Russia and Bangladesh appear in all three properties with no clicks at all. Shop C drew 63% of its impressions from zero-click countries while every click came from Germany.
Merchant Center did not record the same movement. For shop C, free-listing impressions and clicks were flat from April to October, with no May step and no Oct 9 step, and Merchant Center counted more than ten times the clicks Search Console attributed to merchant listings. The two were never going to match on totals, because Merchant Center covers the Shopping tab, Images and Lens while the Search Console appearance covers web search only. What matters is that the steps are missing on the Merchant Center side.
The post rules out the nearby explanations:
- The documented Search Console impressions problem over-reported impressions from May 13, 2025 to Apr 27, 2026. It ended three weeks before this started, and its fix left no visible mark on these series.
- Demand did not move like this. Google’s Keyword Planner volumes for Germany, Austria, Switzerland and the UK stayed within ±20% from April to September.
- The Sep 15 removal of free listings in the European Economic Area (EEA) hit EEA clicks, and most of the inflated volume sat outside the EEA, though the two overlap: one property lost 40% of its desktop impressions that day.
What caused it is unconfirmed. DrKJING’s guess is automated queries being counted as merchant-listing impressions, heavier from mid-May and absent since Oct 9, and says it cannot be proven from outside Google. A reporting change on Google’s side in May and again in October fits the same evidence. Under either explanation those impressions were not demand, so the distinction does not change what anyone should do with the numbers. Google has documented nothing that covers it: the thread’s author checked the Search Console data anomalies page on Oct 20 and found no entry about merchant listings or desktop. The sample is one person’s set of shops, small and all European, with country data for two weeks only.
What to do
Filter the Performance report by search appearance and by device before reading any merchant-listing trend. A property-level view mixes the distorted desktop series into everything else, which is how a flat site ends up looking like it gained and then lost visibility. Shop A’s average position read 5.5 in mid-September and 8.1 after Oct 9 with nothing changed on the site.
For any comparison that spans May 16 to Oct 8, including year-on-year, use clicks. Clicks were not inflated in this data, and impressions, CTR and average position were.
Two checks from the thread will tell you whether a property shows the same thing. Split CTR by device inside the merchant listings appearance and look for a desktop figure that sat far below mobile for months and then snapped up to it. Then check the share of impressions from countries that produced no clicks over the same window, since a real demand shift moves clicks somewhere.
Watch out for
Treating the numbers since Oct 9 as a return to normal. If this was a reporting change rather than query traffic, the pre-May baseline may be off too, and in this data April was already running about 20 times what the same report counts today.