AI Overview coverage is 62% or 82% depending on the tracker
Summary
Trackers put Google's AI Overview coverage anywhere from 62% to 82.5% of searches, so the number depends on which keywords the tool samples.
Measure AI Overview exposure on your own tracked keyword set before setting a visibility target or a traffic forecast.
AI Overviews now appear on more than 80% of Google searches, Search Engine Roundtable reported on October 26, citing recent data from Semrush, SE Ranking and seoClarity. The three trackers do not agree, and their readings sit about twenty points apart.
Each one counted a different set of queries:
| Tracker | AI Overview coverage | What was counted |
|---|---|---|
| Semrush Sensor | over 80% | its live tracked panel, broken out by industry and query type |
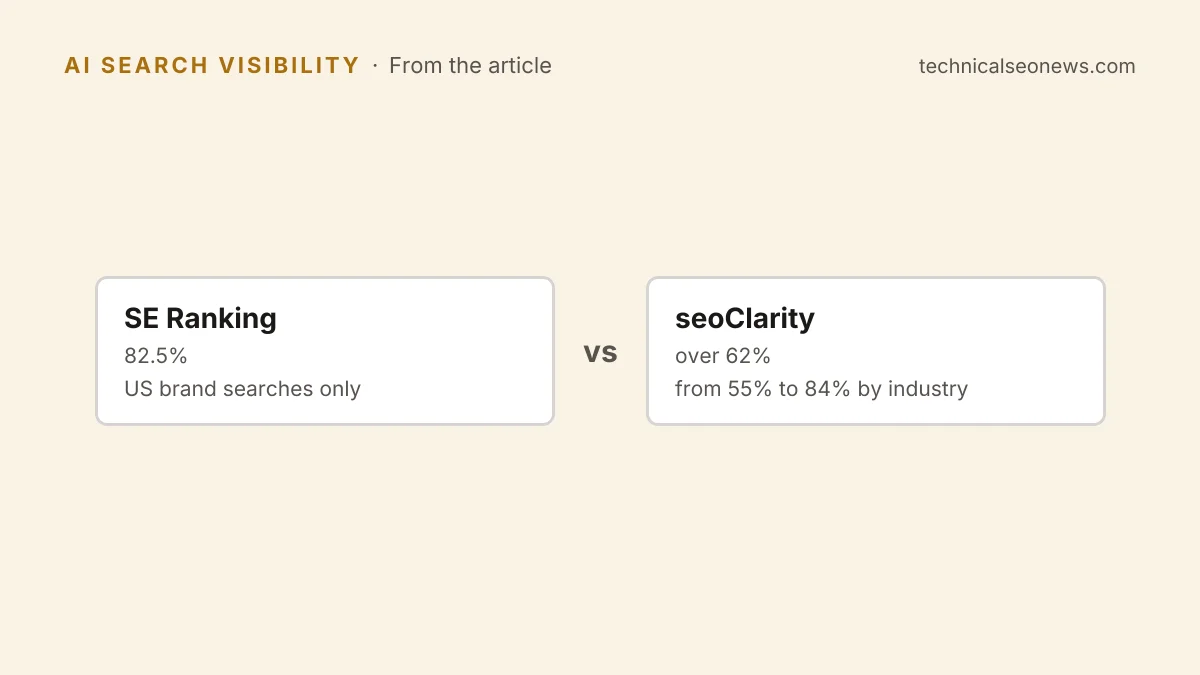
| SE Ranking | 82.5% | US brand searches only |
| seoClarity | over 62%, from 55% to 84% by industry | queries generally, about a month earlier |
SE Ranking’s 82.5% is the figure most likely to be misquoted, because it describes US brand searches and nothing else. Barry Schwartz, who edits Search Engine Roundtable, writes that he assumes coverage runs higher still for many non-branded queries. SeoClarity’s 62% across queries in general points the other way, even allowing for the month between the two readings.
The likelier explanation is that the panels are not comparable. A coverage percentage is a property of the keyword list a tool samples, not a property of Google, and query types trigger AI Overviews at very different rates. AI Overviews already covered most large brand names a month ago, while on Semrush’s own panel review queries hit around 90% and other query types sat far below. The seoClarity spread of 55% to 84% by industry says the same thing from the other direction. Any single market-wide figure is an average over a keyword mix that is almost certainly not yours.
The growth is real whatever the panel. Search Engine Roundtable’s running figures put coverage at 50% in June of last year and about 15% the year before, a climb steep enough that a figure more than a few weeks old is stale. The share of your own tracked keywords that returns an AI Overview is the only number that tells you how much of your traffic now sits behind an answer.
What to do
- Pull AI Overview presence across your own tracked keyword set in whatever rank tracker you already pay for, and date-stamp the result. That percentage, not 80%, is what goes into a traffic model.
- Split the set into branded and non-branded before you average anything. Brand terms are close to saturated, so a blended figure hides which half of the exposure is actually at risk.
- Re-pull monthly. Coverage moved far enough in sixteen months that an annual baseline will be wrong by the time anyone acts on it.
- When you quote a market figure to a client or a stakeholder, name the tool, the query mix, the country and the date alongside it. A number without its panel invites a forecast nobody can defend later.