Cloudflare data shows image downloads are rarely what slows LCP
Summary
For page views with a slow Largest Contentful Paint, Cloudflare's new real-user dataset finds the image download is usually the shortest stage. Most of the wait comes from the browser finding the main element late, or from something holding back its paint.
Compressing the hero image is the wrong first fix for most slow LCP. Break your own LCP into its four sub-parts, then fix whichever of discovery or render blocking dominates.
Cloudflare has published BEACON, a public dataset of real-user performance measurements from 10,000 of the largest websites on its network, updated daily in Google BigQuery. Cloudflare’s post announcing BEACON reports Core Web Vitals as full histograms rather than single averages. It also adds the sub-parts of Largest Contentful Paint (LCP) and Interaction to Next Paint (INP). Those sub-parts carry the finding that matters for most performance work: on slow page views, downloading the LCP image is usually the smallest part of the wait.
LCP sub-parts split the time before the main element appears into four stages:
- Time to First Byte (TTFB): the wait for the HTML document. Nothing renders before it arrives.
- Load delay: the time before the browser starts fetching the LCP image, video or web font. Cloudflare’s post frames it as JavaScript dependence slowing discovery of the element.
- Load duration: the download of that resource itself.
- Render delay: time after the resource is ready when something still blocks it from painting.
Cloudflare grouped page views by the Good, Needs Improvement and Poor thresholds and published typical values for each stage:
| LCP rating | TTFB | Load delay | Load duration | Render delay |
|---|---|---|---|---|
| Good | 598ms | 76ms | 119ms | 157ms |
| Needs Improvement | 1015ms | 1049ms | 199ms | 437ms |
| Poor | 1891ms | 1485ms | 119ms | 2002ms |
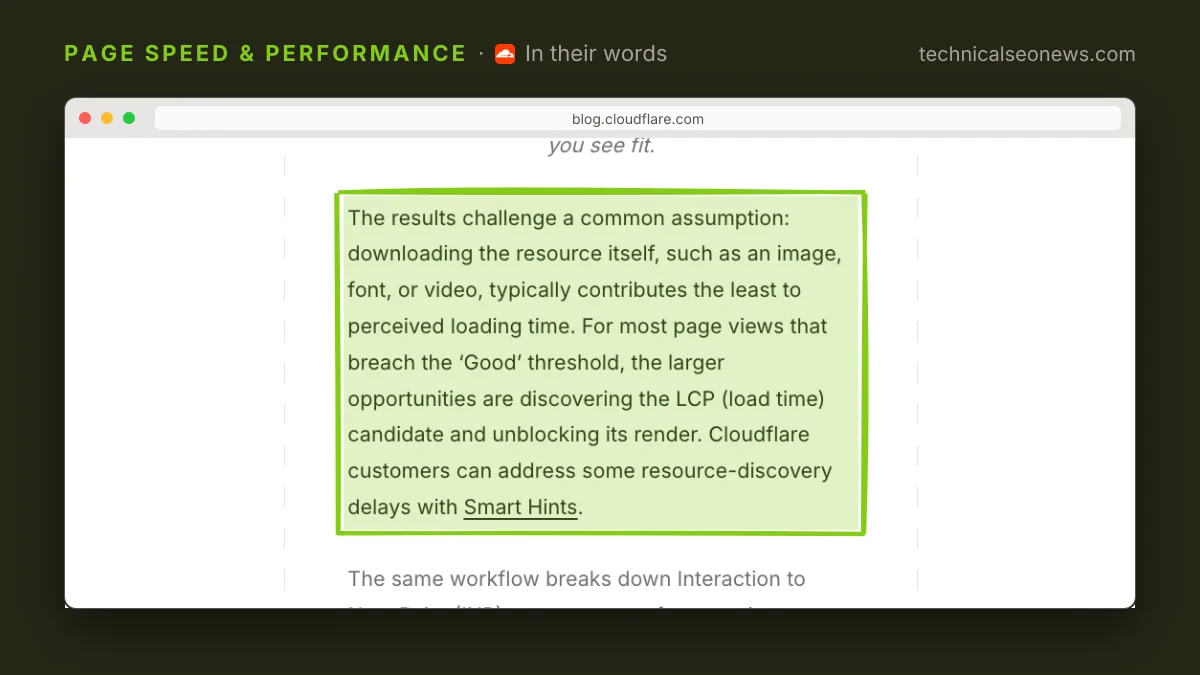
Download time stays under 200ms in every group. Load delay passes a second as soon as LCP leaves the Good range, and render delay passes two seconds at Poor. Cloudflare’s post states the conclusion plainly: downloading the resource “typically contributes the least to perceived loading time,” and for most page views that miss Good, the larger opportunities are discovering the LCP element and unblocking its render.
The usual first response to a poor LCP score is to compress the hero image or convert it to a newer format. The BEACON numbers suggest that work trims the stage that was already shortest. The likelier cause of a slow LCP is that the browser learns about the image late, because JavaScript inserts it or it is lazy-loaded, or that something holds the paint once the file has arrived. Calibre, which sells web performance monitoring, tested lazy-loaded hero images and found lazy-loading delayed the hero by 262ms. TTFB is also large for slow page views, so a slow server can still be the first thing to fix on a given site.
INP splits the same way, into input delay, processing time and presentation delay. For poor interactions, processing time (the JavaScript that handles the click or tap) is the largest stage at 284ms. Presentation delay, the time to paint the update, climbs to 217ms, which Cloudflare attributes mostly to complex CSS layout recalculations. Input delay, the wait for the main thread to free up, stays the smallest stage even at Poor.
The figures are aggregates across large sites, and one site’s breakdown can look very different. The dataset tells you where the web as a whole loses time, not where your pages do.
What to do
- Break your own LCP into the four sub-parts before touching image weight. Chrome DevTools’ Performance panel shows LCP by phase for a single load, and Cloudflare says the sub-parts will arrive in its RUM dashboard in the coming weeks.
- If load delay dominates, put the LCP image in the server-rendered HTML with a real
src, and never lazy-load it:
<img src="/hero.webp" fetchpriority="high" width="1200" height="675" alt="...">- If render delay dominates, look for what blocks the paint after the file arrives, starting with stylesheets and scripts in the
<head>. - For poor INP, check the style and layout work each interaction triggers, not only the event handler code. Cloudflare customers can use Zaraz, Cloudflare’s tool for loading third-party scripts, to cut the cost of those scripts.
- To compare against the wider web, query BEACON directly. It sits in BigQuery under the project
cf-open-web-performance, datasetrumarchive. Cloudflare stores the query behind each table next to the dataset, including ‘Global LCP Sub-parts’ and ‘Global INP Sub-parts’, so you can change the filters and rerun them. The histograms let you look past the 75th percentile to the long tail, where the slowest experiences sit.