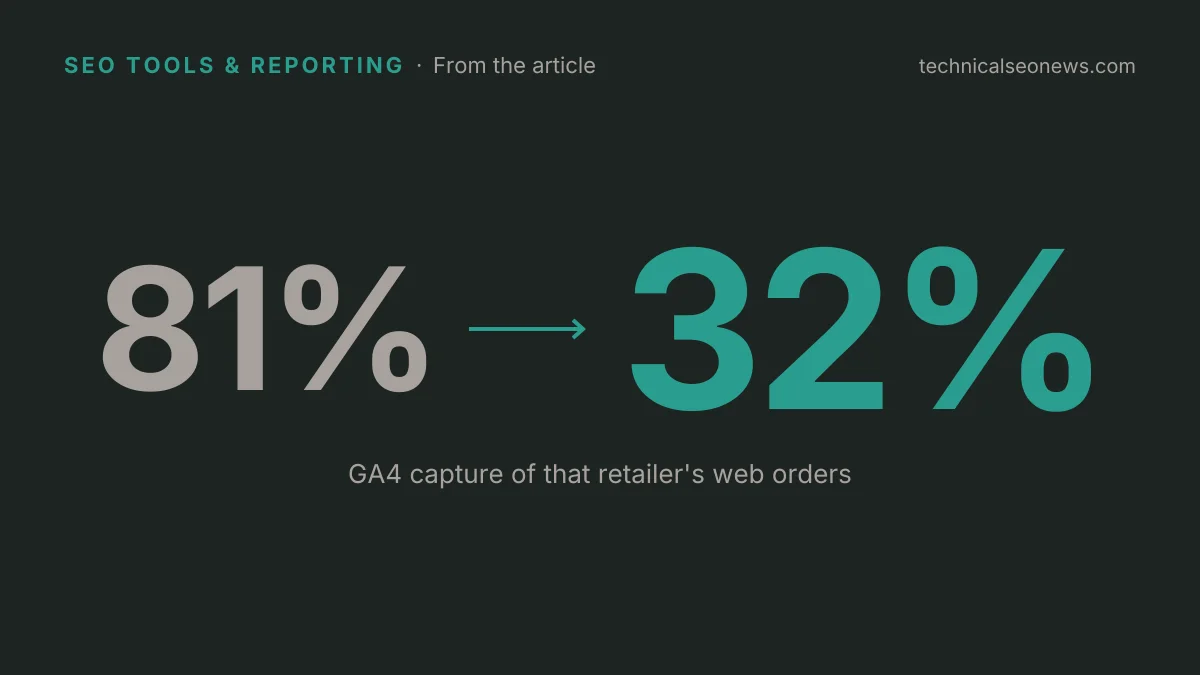
GA4 recorded 32% of one UK retailer's Christmas orders
Summary
An audit of eight UK ecommerce brands found GA4 recording a third of one retailer's Christmas orders, with nothing inside GA4 to show that anything was missing.
Export GA4 purchases and store orders week by week and divide one by the other before peak season starts.
GA4 recorded 32% of one UK retailer’s web orders over the Christmas period of 2025. The figure comes from a Search Engine Journal audit of eight UK ecommerce brands that set GA4’s Q4 numbers for 2024 and 2025 beside the stores’ own order records.
The same property had captured 81% of that retailer’s web orders in Q4 2024. Over Christmas and the first days of January, GA4 reported revenue down 68% a day against the year before, while the store’s order records showed a fall of 13%. Six of the eight brands let their GA4 be matched against order records, and at three of the six the two sets of numbers told different stories. The audit’s author, Christian Goodrich, head of organic search at the agency SOZO, discloses that the agency has worked with all eight brands.
A consent banner that switched itself off
At two stores, GA4 sessions dropped out in blocks of days, and every block ended on the same date each month: the 14th at one, the 20th at the other. Both had moved to a new consent setup during 2025, on a plan that covered a set number of page views a month. Once the allowance ran out, the banner stopped showing until the next billing date, and a page serving no banner collected no consent and sent nothing.
GA4 kept receiving some data throughout, so nothing looked broken. At the second of the two stores, GA4 captured up to 68% of orders in the weeks the banner stayed up. In the weeks it switched off, capture fell to between 10% and 22%. That store’s GA4 showed Q4 revenue down 69% while its net sales rose 18.5%. A tracking failure that leaves the charts populated reads as a slump in demand, which is the same misreading as a 63% Search Console drop that was not one EEA shop’s real loss.
The first retailer’s allowance ran out on December 1, in the Black Friday billing cycle, and GA4 did not recover until December 15.
Why the quarterly total looked fine
At a third store, GA4 recorded no purchases at all from October 28 to December 4, 2025. The store itself took 2,215 orders in that stretch. On December 9, GA4 took in 1,261 purchases in a single day, a thousand of them carrying order numbers from inside the gap, and all but five of those landed in Unassigned.
The same store was also counting orders twice. GA4 removes duplicate purchase events sharing a transaction ID only when they arrive from the same user, per the guidance quoted in the audit. For that store’s fourth quarter of 2025, GA4 held 3,365 order numbers. Of those, 657 carried more than one purchase event, and the duplicates added 735 purchases.
Those two faults ran in opposite directions and nearly cancelled. GA4 closed Q4 with 4,100 purchases against 4,501 store orders, close enough to pass a quarterly reconciliation, while the weeks underneath it were wrong in both directions. That is the argument for dividing GA4 purchases by store orders week by week instead of checking the quarter.
Two of the audited stores produced the steady ratio that means nothing is broken, one of them at 76% of web orders in both quarters. A capture rate that holds in the same band each week is consent decline, and GA4 is still good for trends. A rate that swings is a fault.
What the gap costs in budget
The first retailer’s Q4 web orders rose from 5,874 to 7,686 while GA4 showed them falling by a third, and the channel figures moved with the totals.
| Google Ads return on spend | Q4 2024 | Q4 2025 |
|---|---|---|
| As GA4 reported it | 8.07 | 4.79 |
| Matched to store orders | 4.42 | 7.93 |
Attribution models differ, but pointing in opposite directions is not a modelling difference. A team cutting Google Ads on the GA4 line would have taken spend out of a channel that was working.
What to do
- Export GA4 purchases and store orders for the same weeks, divide one by the other, and read the band rather than the total. Do it for last Q4 and for the weeks since, because a fault that started in October will not announce itself in November.
- Look for sessions dropping out in blocks that begin or end on the same date each month while orders carry on. That pattern points at the consent plan, not at the market. Check what the plan covers against peak traffic, and get its limit warnings routed to whoever watches the numbers rather than only to developers.
- Build a GA4 exploration listing purchase event count by transaction ID. Any ID above one is double counted.
- Divide GA4’s Google organic sessions by Search Console clicks each week. Search Console counts a click whatever the site’s tags are doing, so it holds steady when tagging fails. During the blackout, Google sent the third store 4,244 clicks in the week of November 3 and GA4 recorded 57 Google organic sessions.
- Treat session spikes that orders do not follow as traffic to exclude, not growth to report. GA4’s known-bot exclusion does not catch bots that execute site code like a browser.